Report on Menus Assignment
Comments about what should be in your report can be found in italics
Introduction
Write two sentences describing the purpose of the experiment. This
can be the same text you use in your consent form under
Introduction and Purpose of study (Beneficience)
Method
Tasks: Describe the 6 conditions of the study. Explain how many items were selected per menu, and how many times each item was repeated. Describe how many trials each participant completed. This should be at most one paragraph
Setting: What device was used? Was it an emulator? Where did the experiment take place?
Participants: Describe your participants (without identifying them). How were they recruited? How many were there? Were they consented? You can also add some optional information such as: What was there average age? What genders were present? How experienced were they with android?
Data Collected: What information was collected (time, errors, etc)
Results
To analyze your data, you should copy the following spreadsheet:
Google Sheet
and paste your data into the Raw Data subsheet, replacing the
contents/data that we placed there. To use this spreadsheet look at
the Example Chart sheet to see a chart of your data (you can click on
the hamburger menu in the chart to download it as an image). You can
also create your own charts if you are
comfortable working in a spreadsheet.
The results will be broken into two parts. The first will describe the overall data, including how many erroneous selections took place, and how fast the user was in each condition.
Speed Results
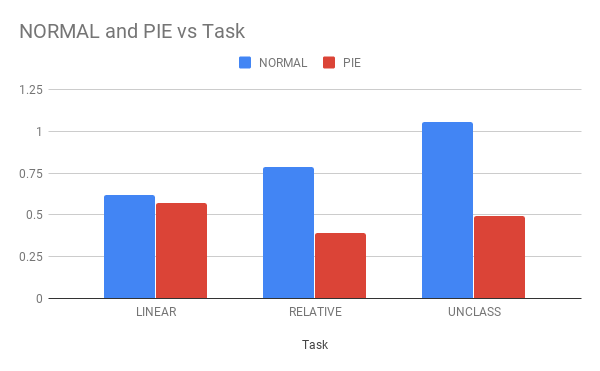
Describe your thoughts about overall speed in different conditions. Use at least one chart to illustrate what you say. Here is an example chart generated using our data, when you paste your data into the spreadsheet you’ll see that it updates to reflect your data
Statistical Significance of Time (OPTIONAL)
You can click on Speed Analysis in your spreadsheet and look at F3-H8 to see what if anything is
significant. That is also where I copied this table from
| ANOVA | SS | DF | MS | F | P value (.05) | P value (.01) | P value (.001) |
|---|---|---|---|---|---|---|---|
| SS Menu | 0.777 | 1 | 0.777 | 295.891 | TRUE | FALSE | FALSE |
| SSTask | 0.492 | 2 | 0.246 | 93.778 | TRUE | FALSE | FALSE |
| Menu Task Between | 0.682 | 5 | 0.136 | 51.945 | TRUE | TRUE | TRUE |
| SSMenu*Task | 0.261 | 1 | 0.261 | 99.346 | FALSE | FALSE | FALSE |
| SSwithin | 0.100 | 38 | 0.003 | 0.000 | |||
| Total | 1.630 | 43 |
Include your own table instead
We studied the difference between conditions. An ANOVA was used to compare the main effects of menu type and the interaction effect between menu type and task type on selection time. The null hypothesis was that there is no difference between conditions. Menu type included 2 conditions (Normal and Pie) and task type included 3 conditions (Linear, Relative and Unclassified). The following main effects were statistically significant:
look at F G and H to find p value for rows 4 through 9. Averages for different conditions can be found in column G (rows 13-18) for interaction effects and column H and I rows 21-35 for main effects. In my data, shown above, I’d say:
Pie menus were twice as fast as normal menus (M=.48s vs M=.83s), F(1,43)=295.891, p<.05. Unclassified menu items were harder to find than linear and relative ones (M=.84s, .59s, and .59s respectively), F(2,43)=93.778, p<0.5. We also found an interaction effect between menu and task (as illustrated in the chart above), F(5, 43) = 51.945, p<.001.
All of the numbers are copied over from my spreadsheet and can be seen in the sample you are copying from. Note that my DF (degrees of freedom) numbers are different than yours will be because I only ran 3 participants.
Error Results
Describe what happened in terms of errors – provide at least one chart showing what you learned about errors in different conditions
Statistical Significance of Error (OPTIONAL)
Repeat what was done for time
Conclusions
Describe your conclusions. Do you think we should use pie menus more? What can we conclude from your data?